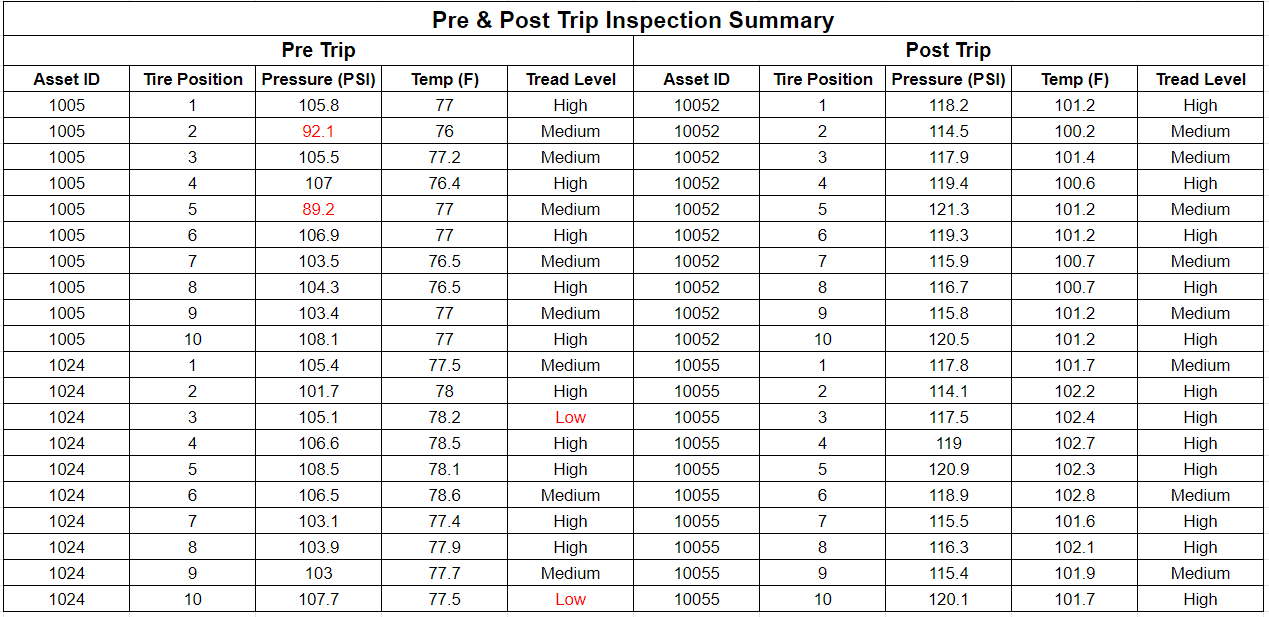
Tire pressure checks are a critical part of vehicle maintenance – but how often should you check tire pressure? Some say once a month is the best option while others…
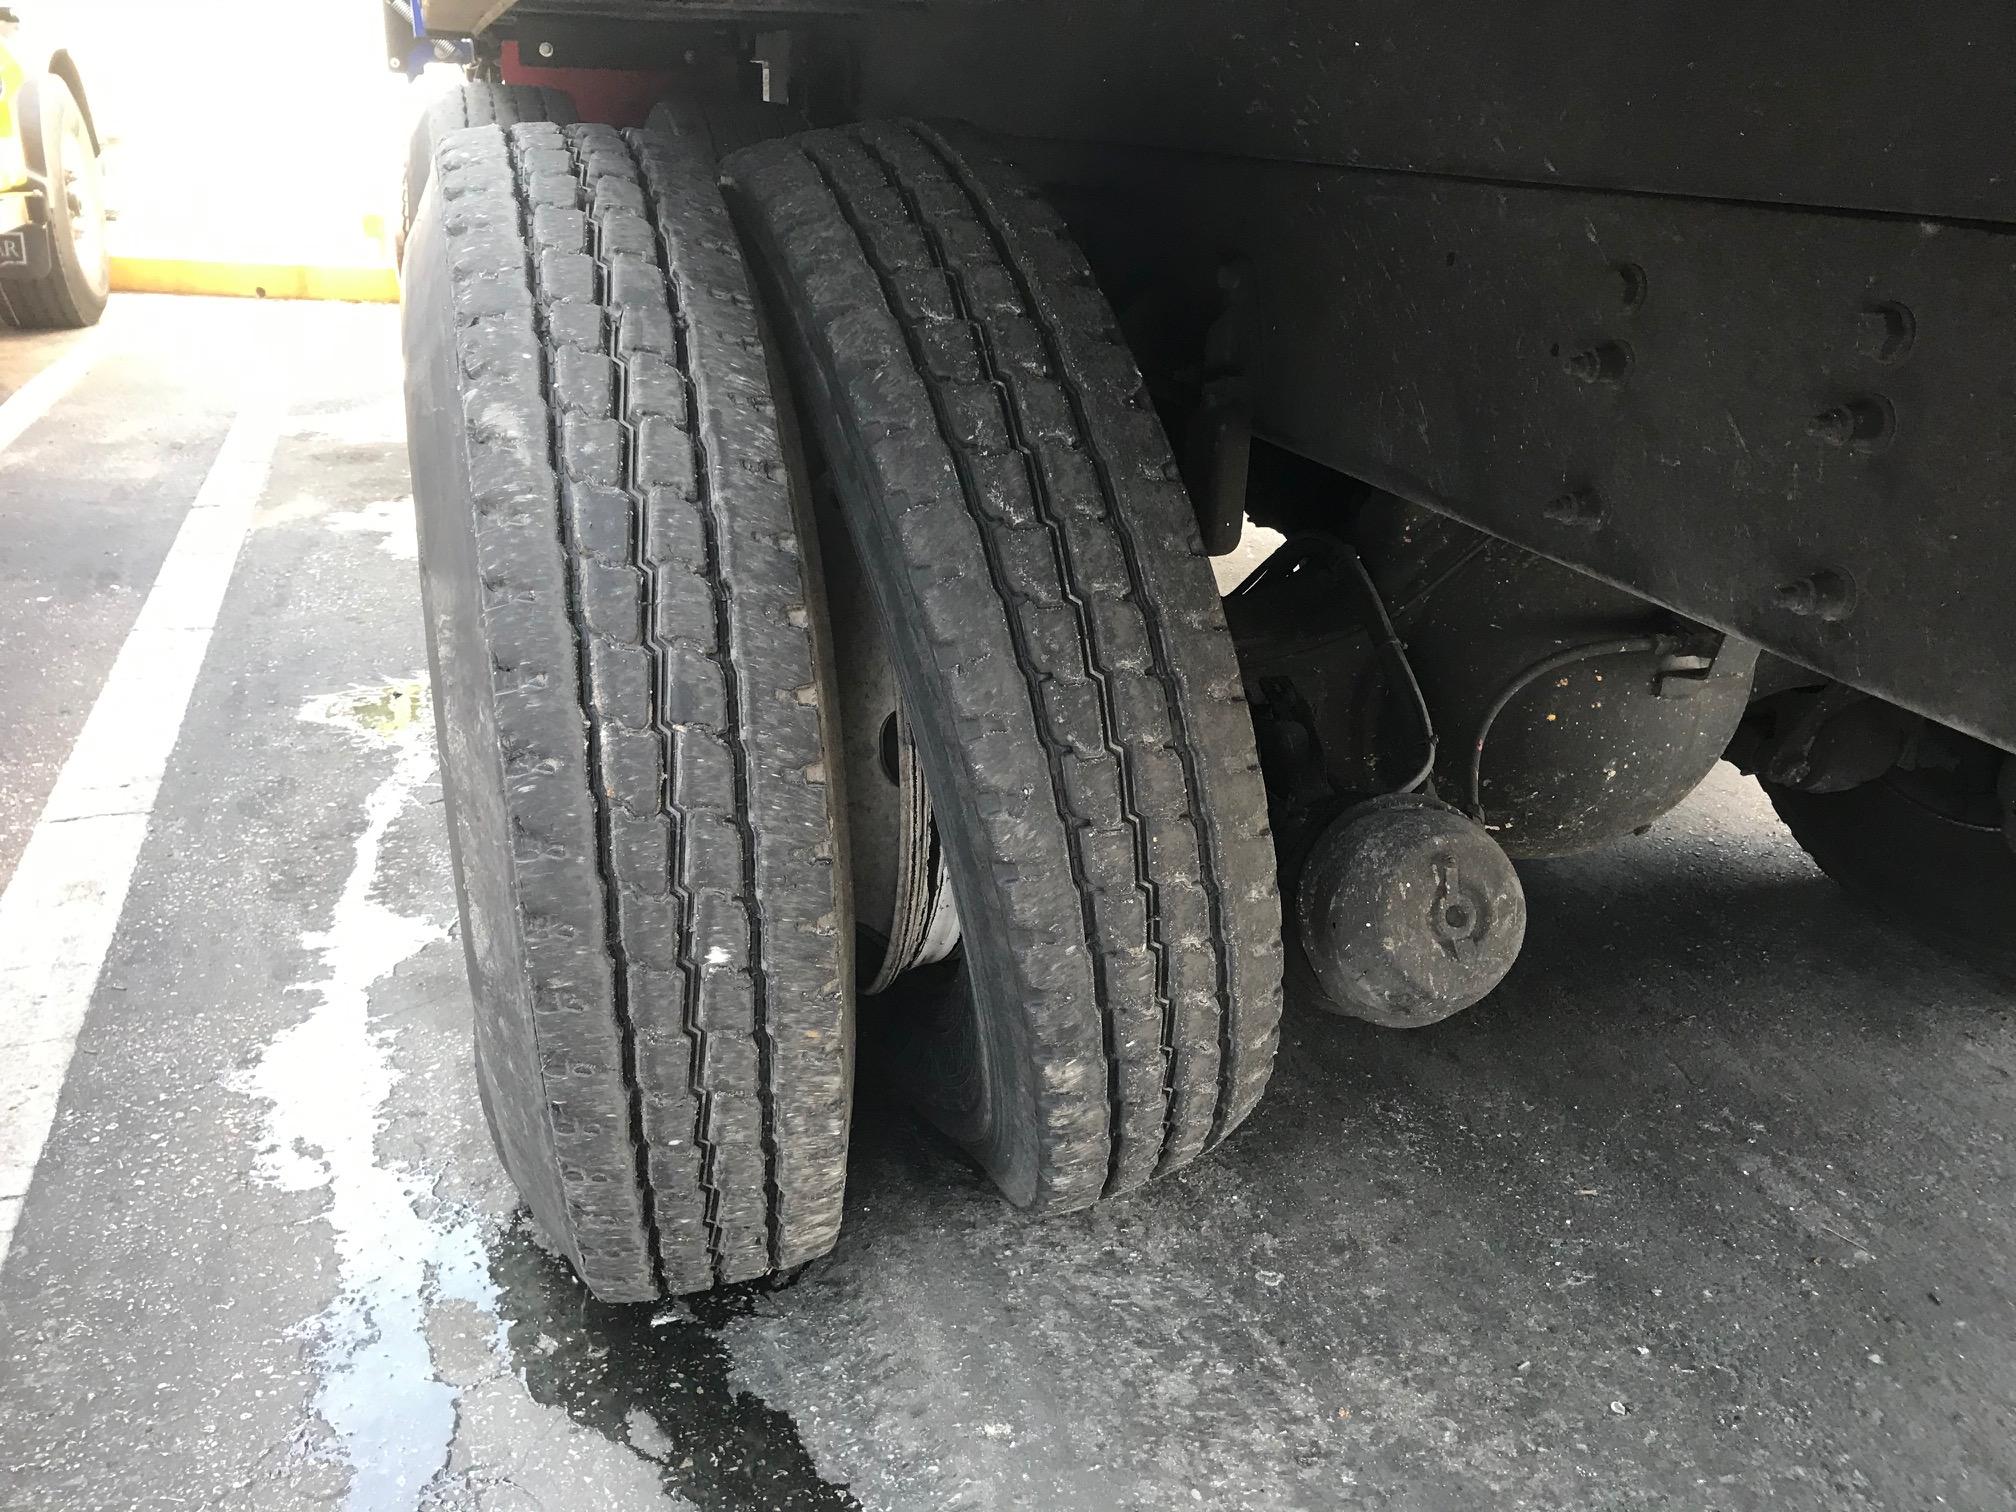
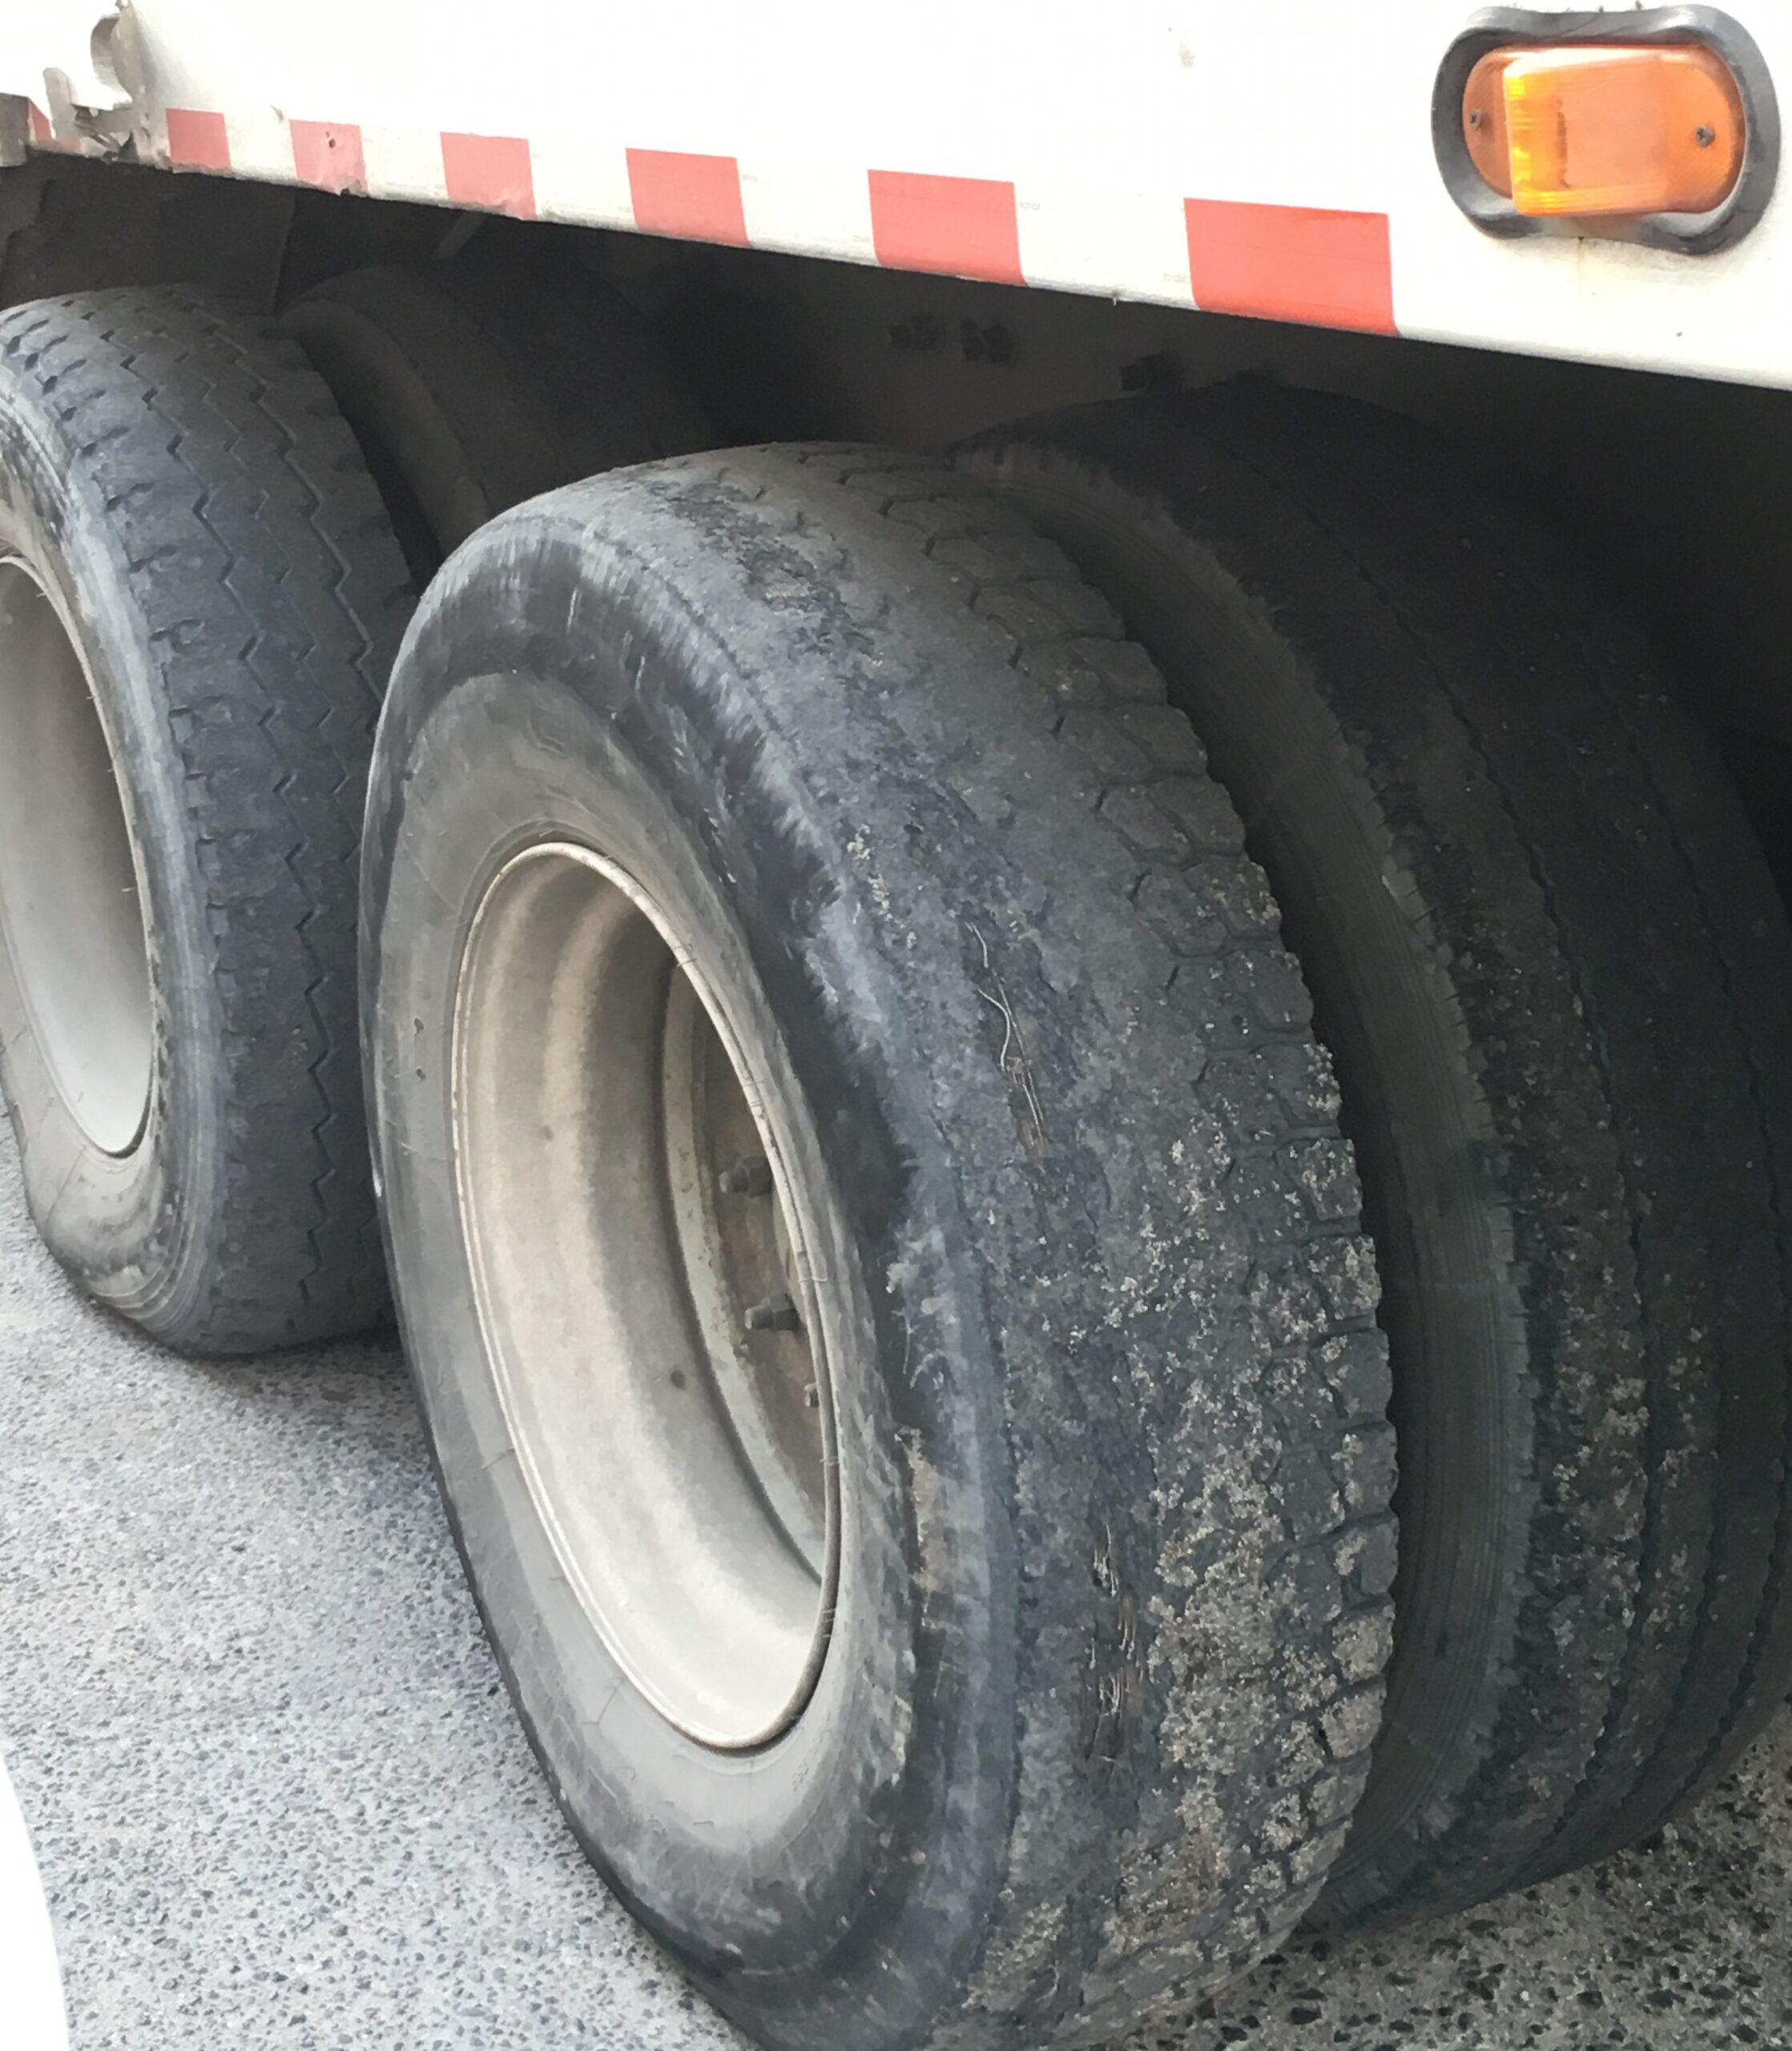
Understanding how tread is being consumed and the maintenance actions we can take to extend tread life is critical to safety and controlling tire spend.